Transform Your Sales Data Into Actionable Insights
dataINSIGHTS consolidates all your sales channels into one powerful dashboard, helping you make smarter business decisions with customizable reports.

dataINSIGHTS consolidates all your sales channels into one powerful dashboard, helping you make smarter business decisions with customizable reports.
Designed specifically for business owners and sales managers who need clarity in their sales performance.
We tailor reports to your specific business needs. We implement your metrics and KPIs to create the perfect view of your sales data.
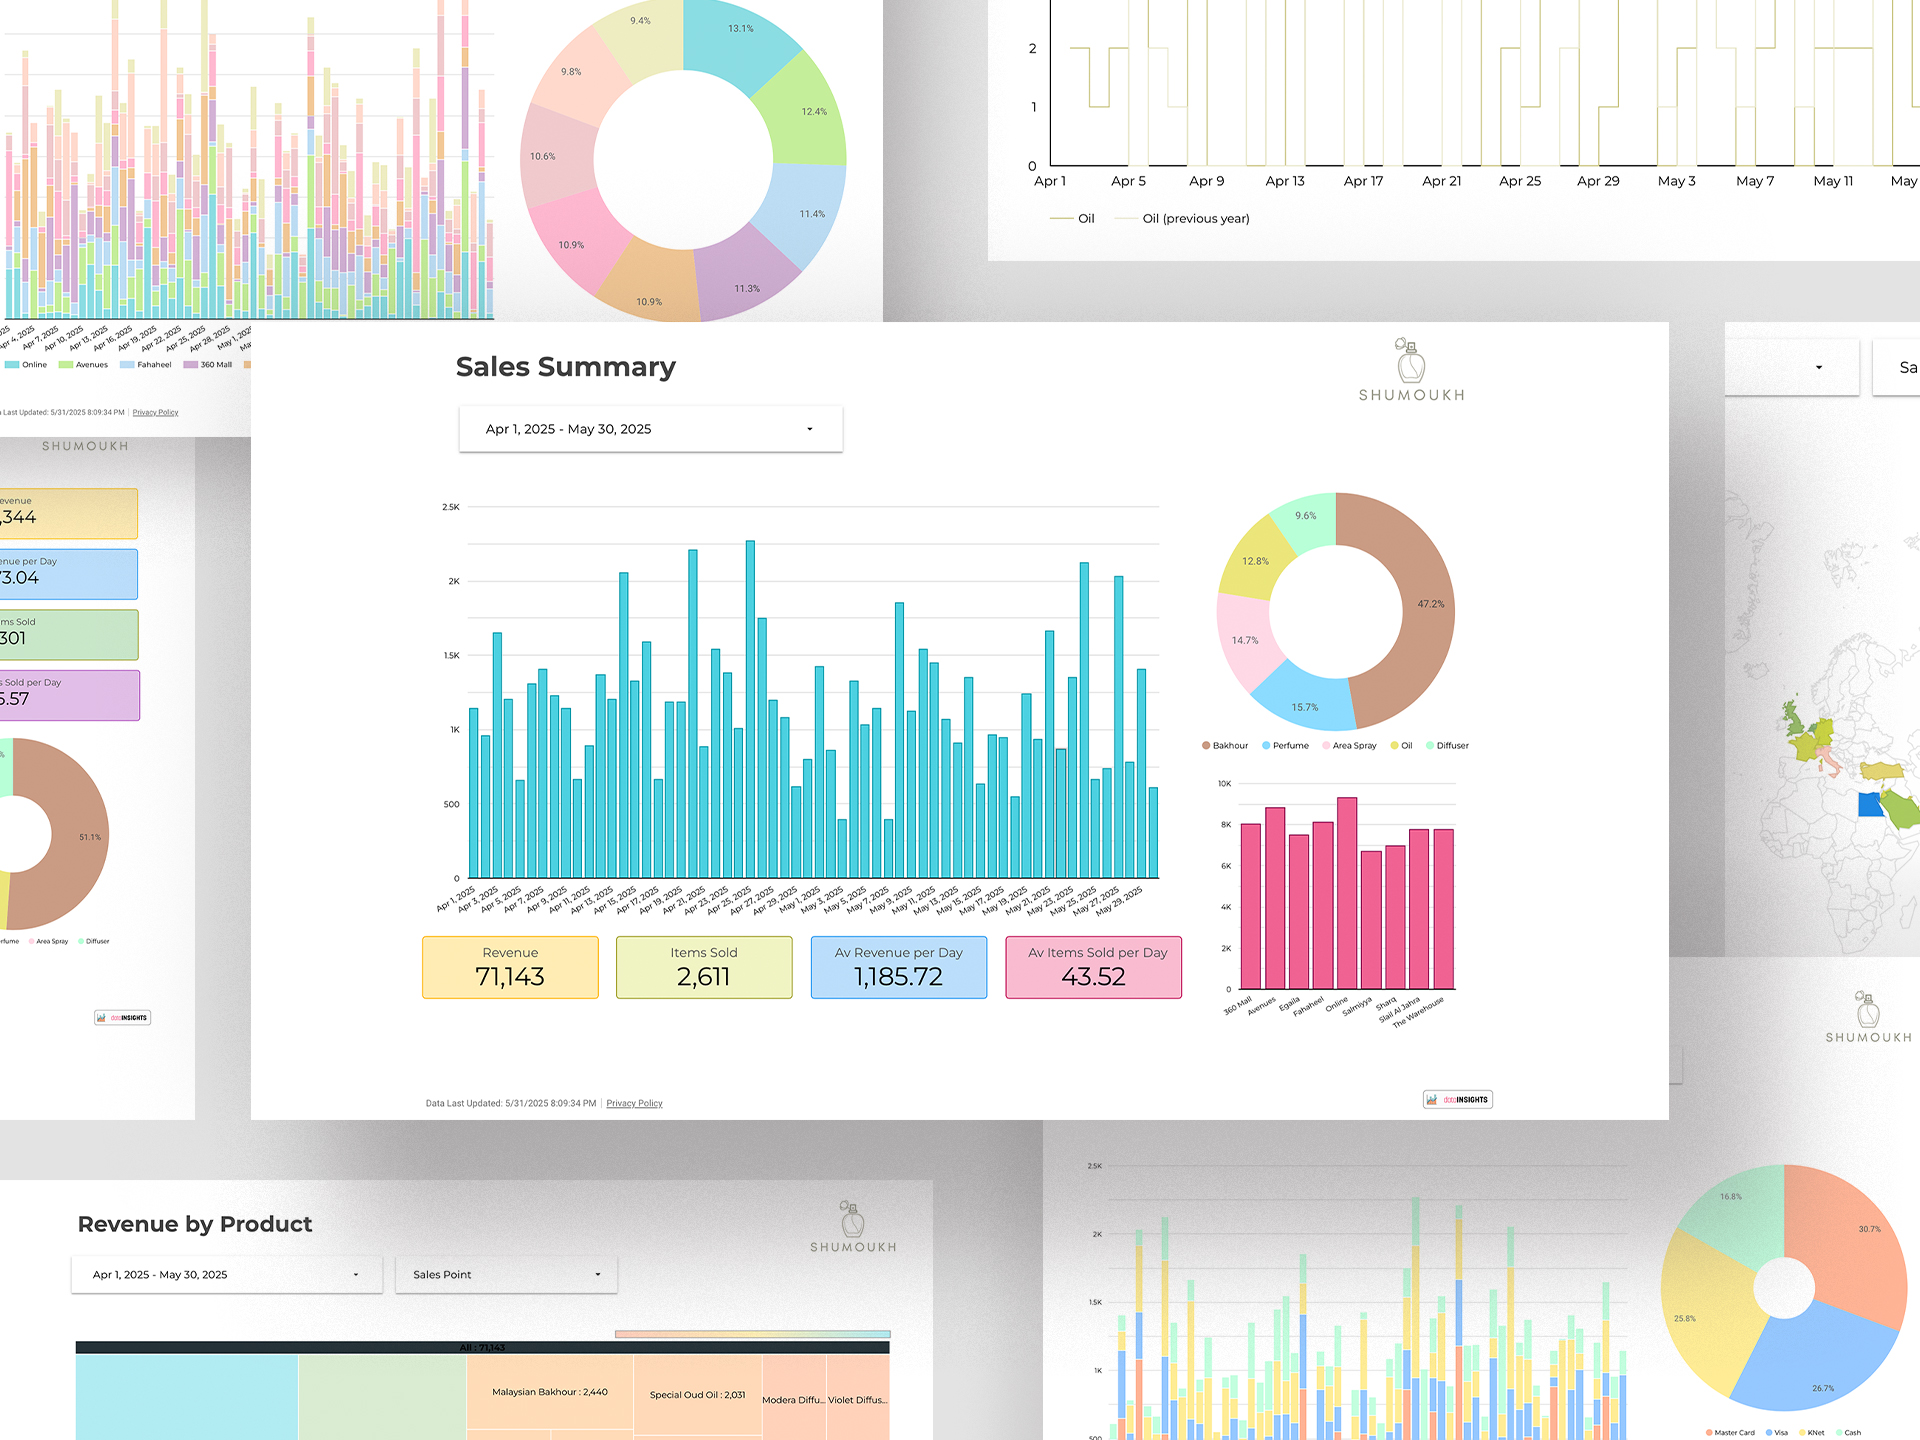
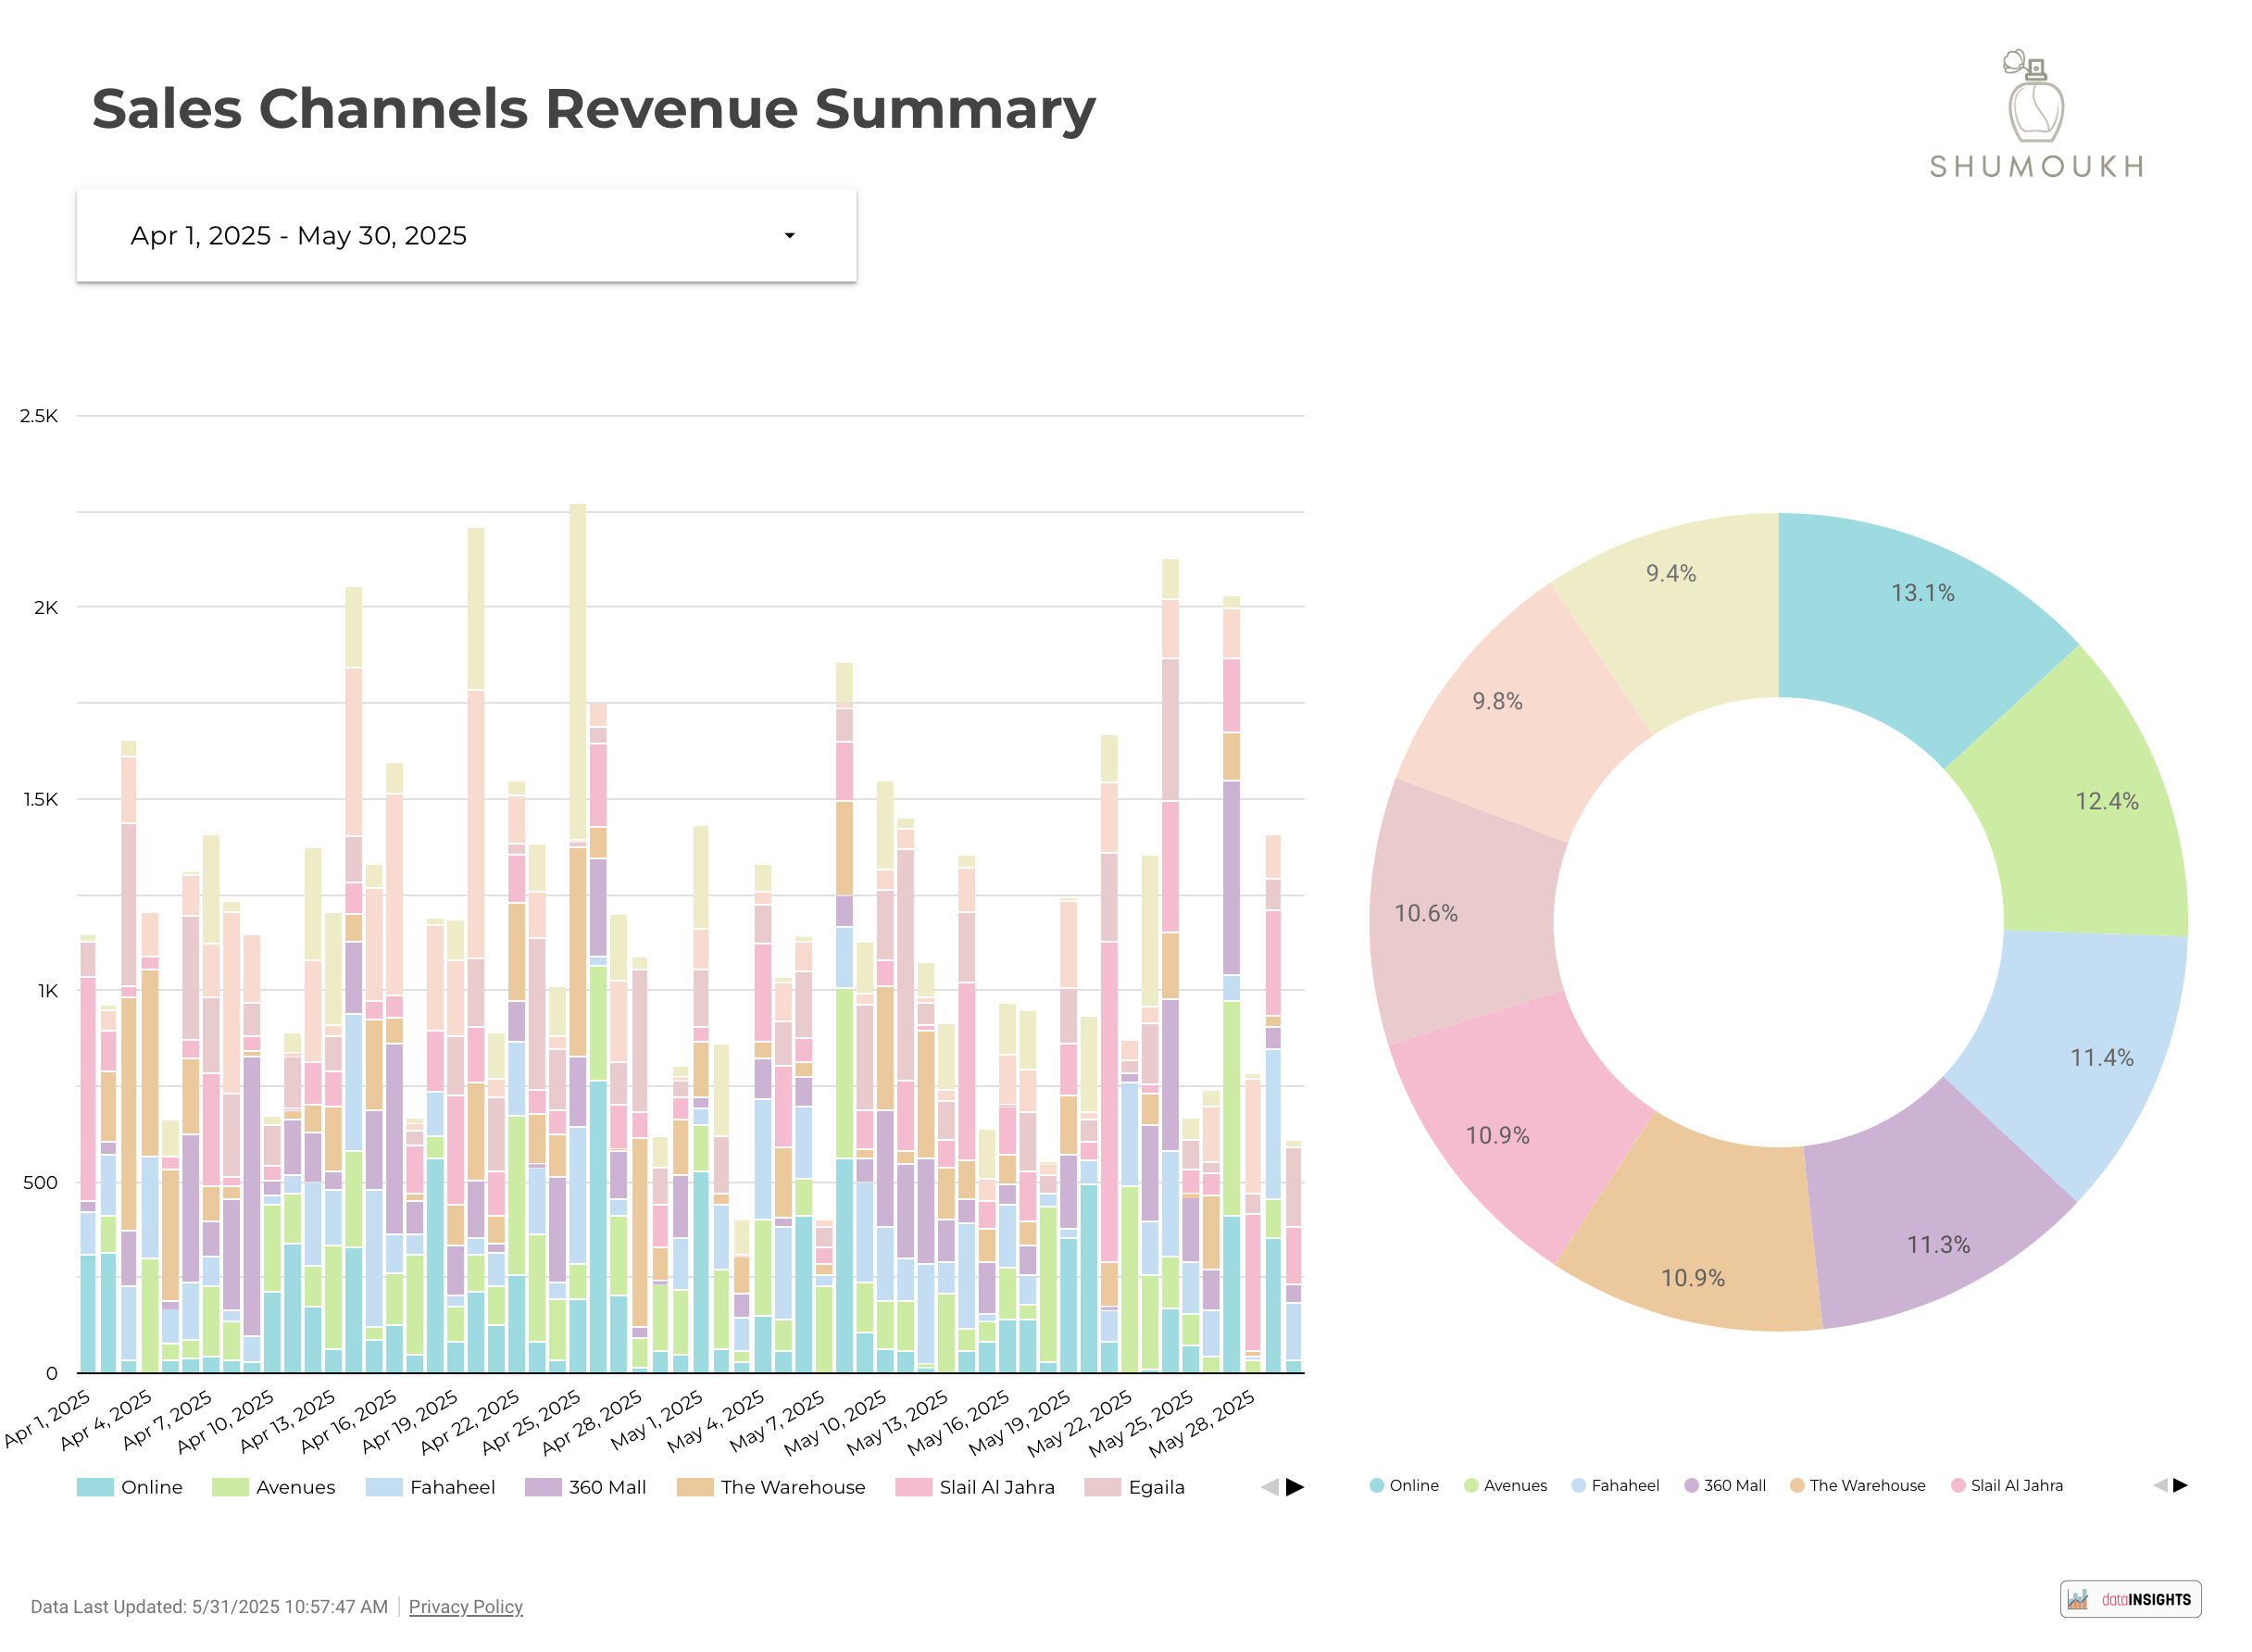
See all your sales channels in one place - eCommerce, retail, wholesale - with consistent metrics for easy comparison.
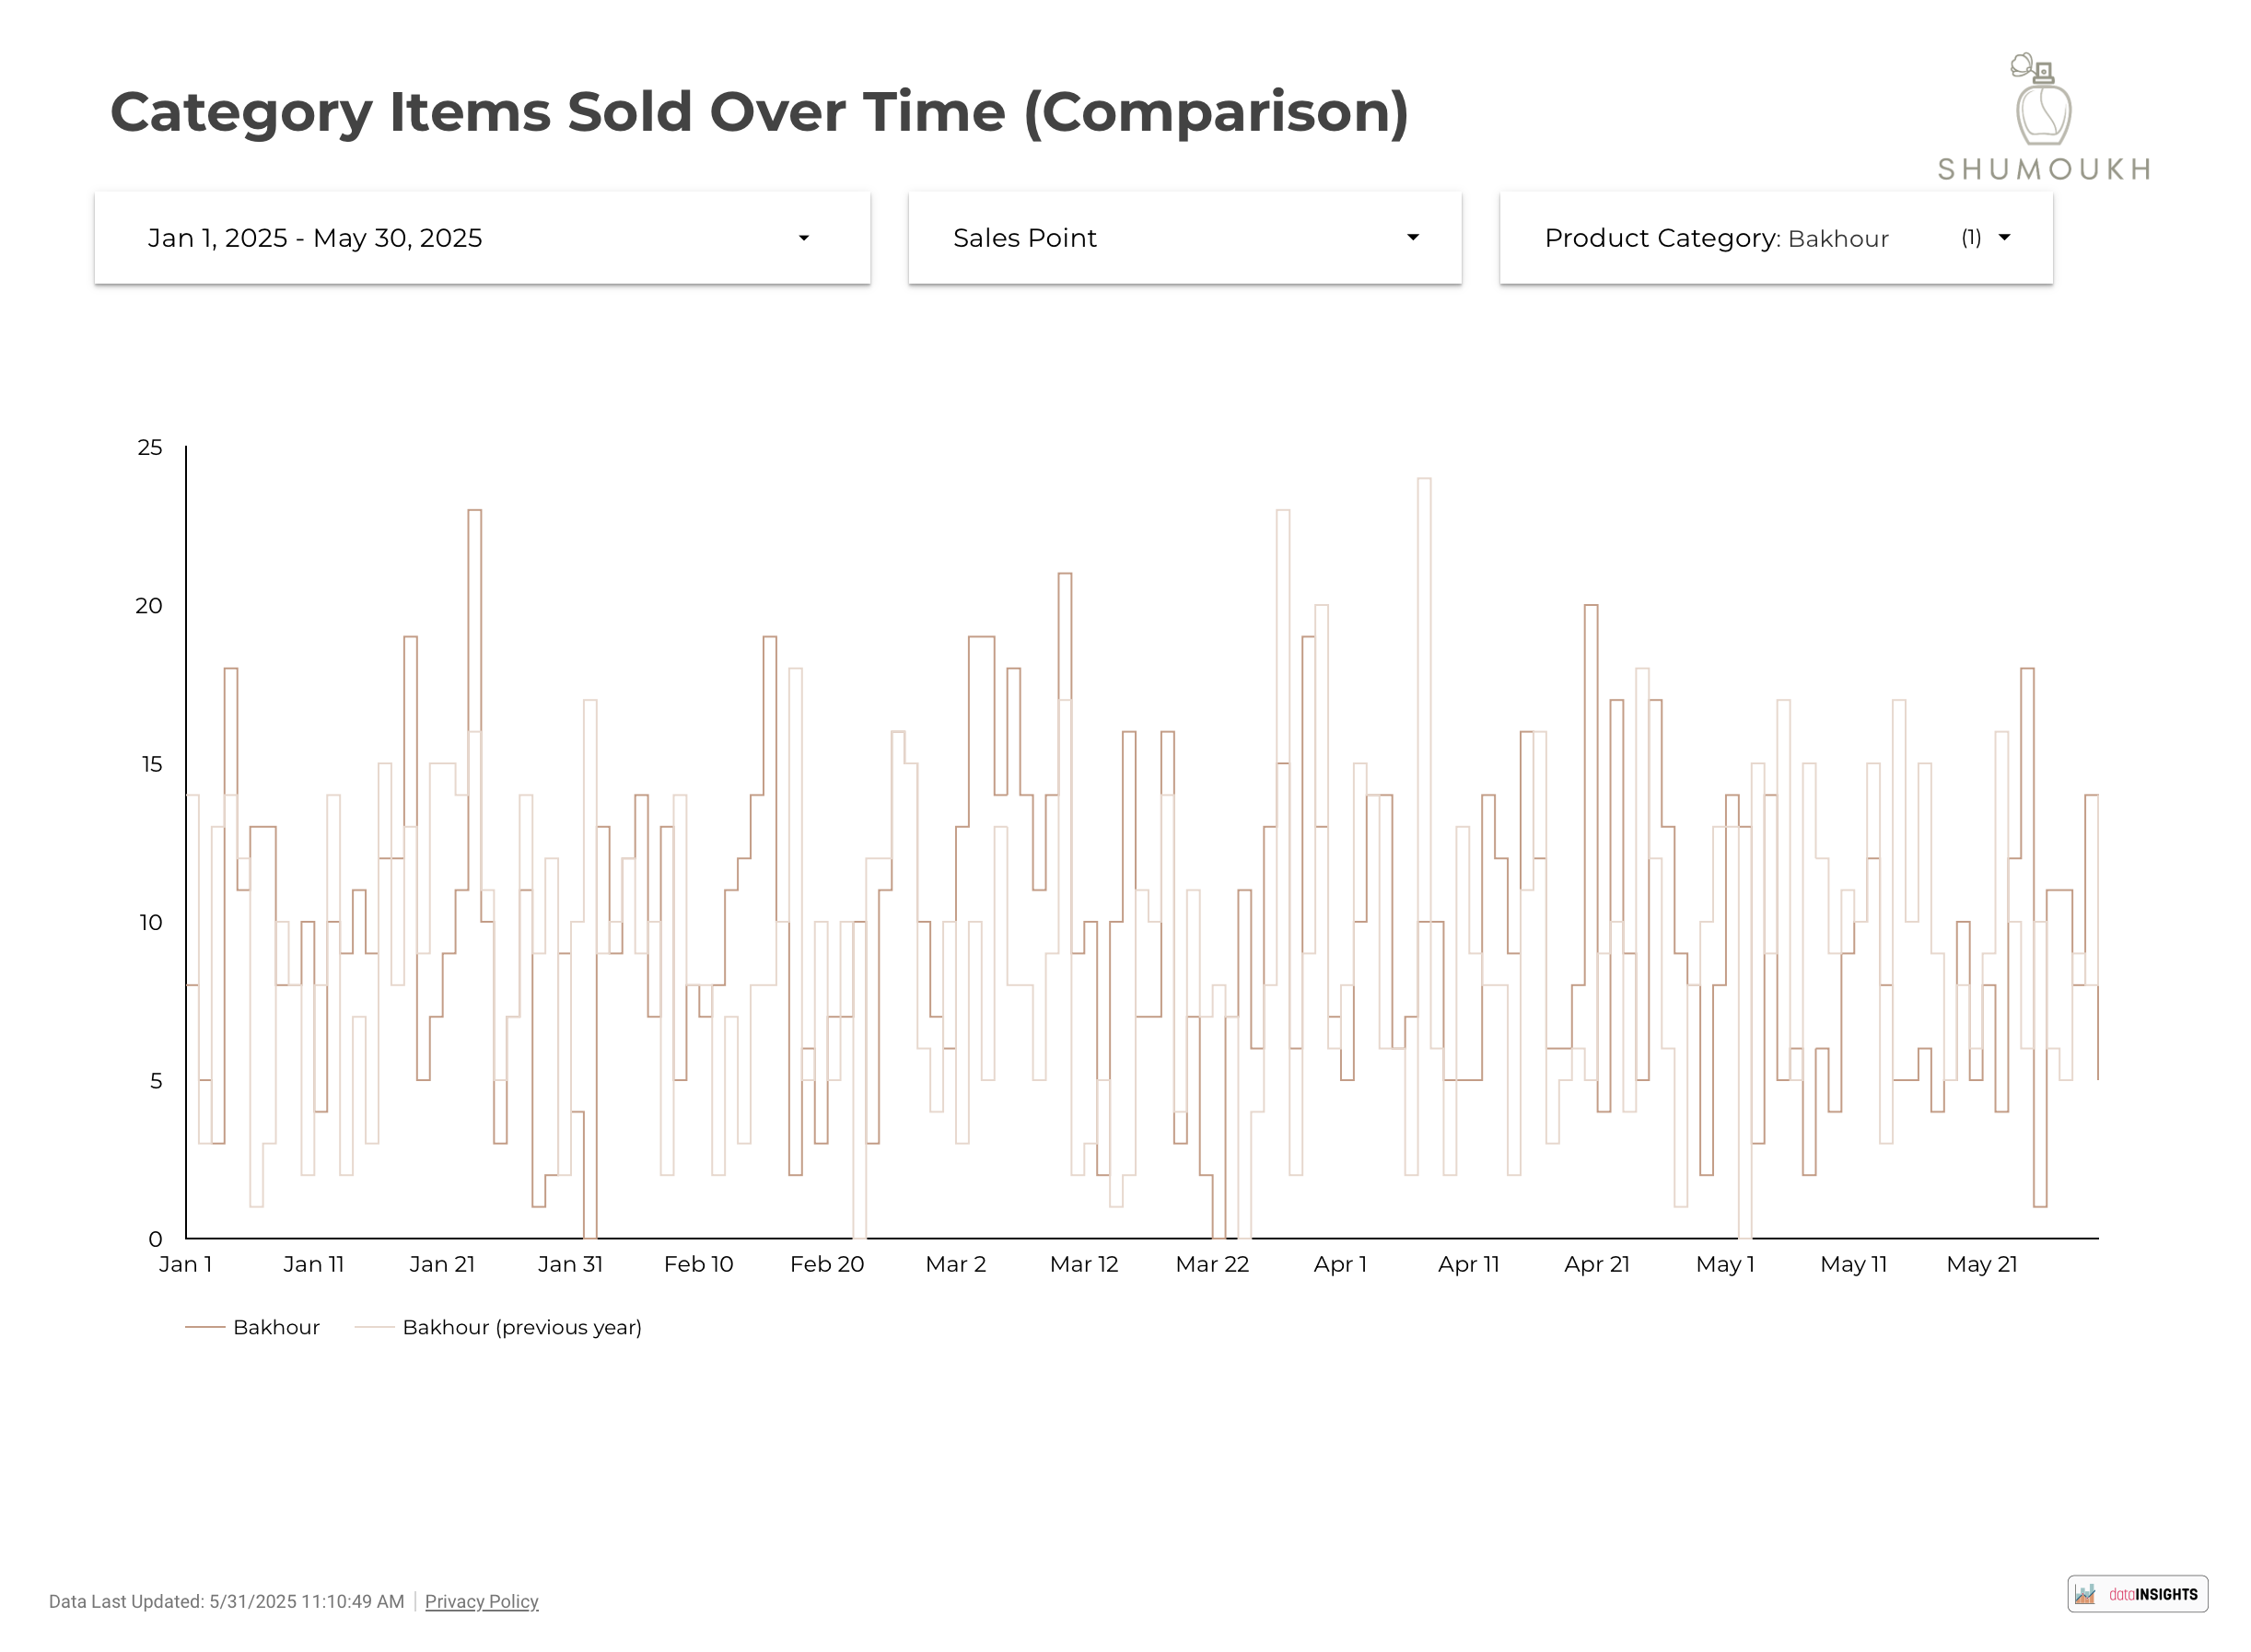
Identify your best (and worst) performing products with detailed analytics on sales velocity, quantities, and seasonality.
Spot emerging patterns before your competitors with advanced trend detection across all your sales data.
Track sales team metrics and individual performance to optimize your sales strategy and coaching.
Gain valuable insights into your customers' payment preferences and strategically plan your business finances.
From data to decisions - our dashboard makes sales analysis simple and actionable.
Stop jumping between platforms and spreadsheets. dataINSIGHTS brings together data from all your sales channels into a single, coherent view.
Every business is unique. That's why we've built powerful customization tools that let you create exactly the reports you need.
Our dashboard doesn't just show you what happened - it helps you understand why and what to do next.
dataINSIGHTS leverages the power of Google's enterprise analytics platform.
Our dashboard is built on Google Looker, providing a robust, secure foundation.
To set proper expectations about our platform capabilities:
To fully appreciate the power and intuitive design of dataINSIGHTS, we encourage you to launch a live demo.
Our dashboards are incredibly versatile, showcasing their adaptability across various industries.
Choose a demo to explore its capabilities:
Have questions about dataINSIGHTS? Contact our team and we'll get back to you within 24 hours.